Record Your Monthly Costs as Best Suits You
The Care Running Costs Calculator gives you the freedom to record and monitor your costs as best suits your business.
Record all your spend and set your monthly budgets.
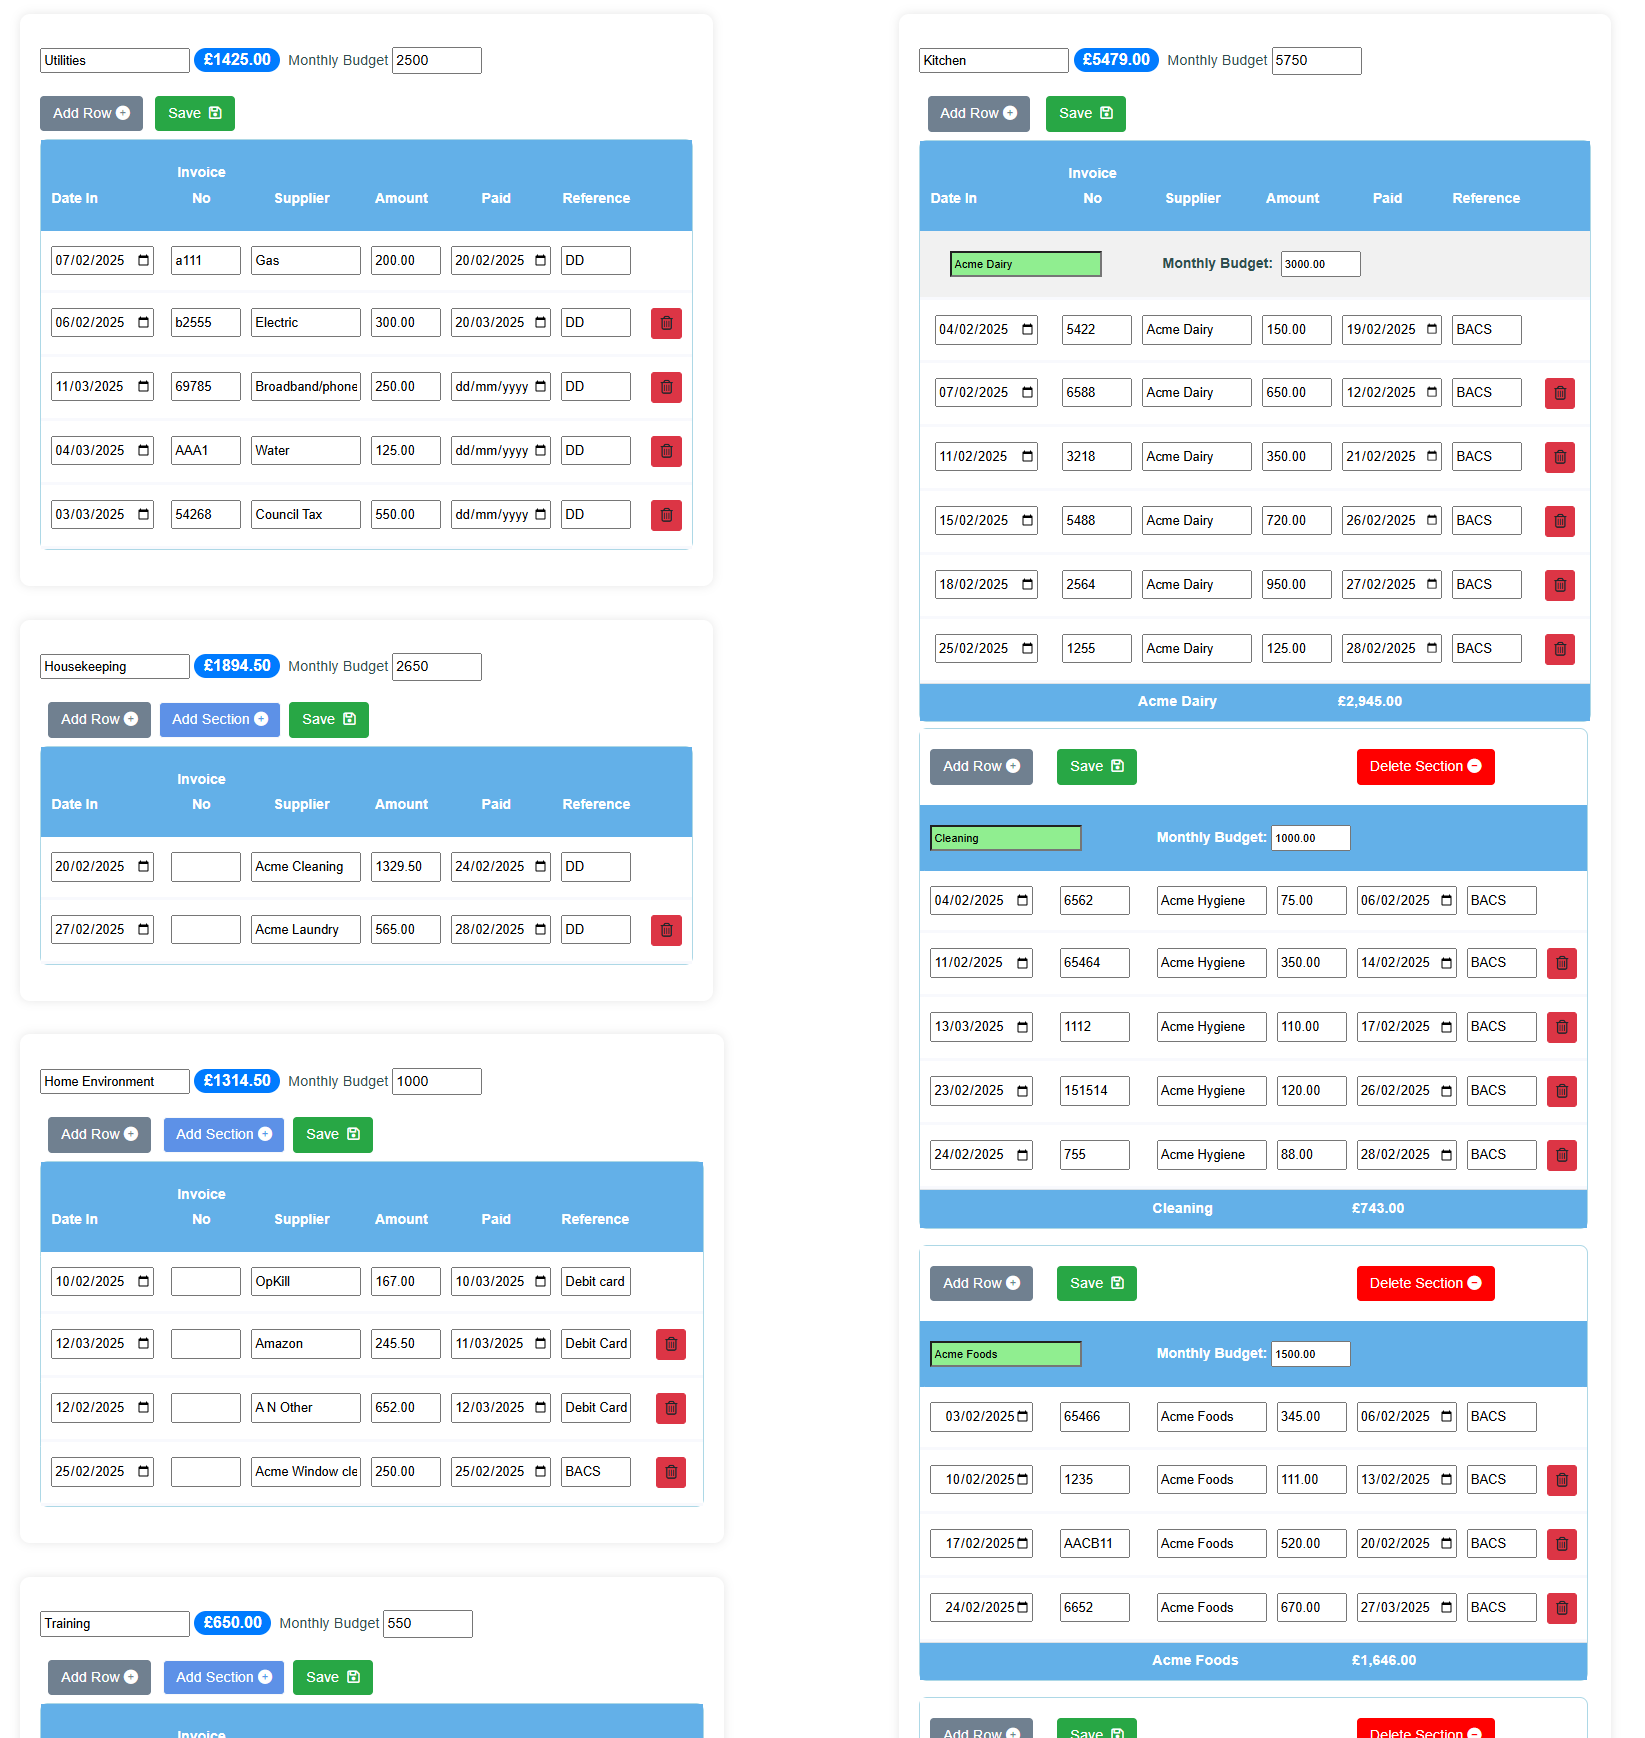
All the tables you need are there and you can add as many lines in the table as you need.
There are 12 sets of tables covering the fiscal year.
See a Summary for the Month at a Glance
See at a glance which areas have exceeded budget for the month.
On the same page, and above the individual cost tables, a Summary table shows the total costs for each table, the budget set for that table and a cost versus budget percentage.
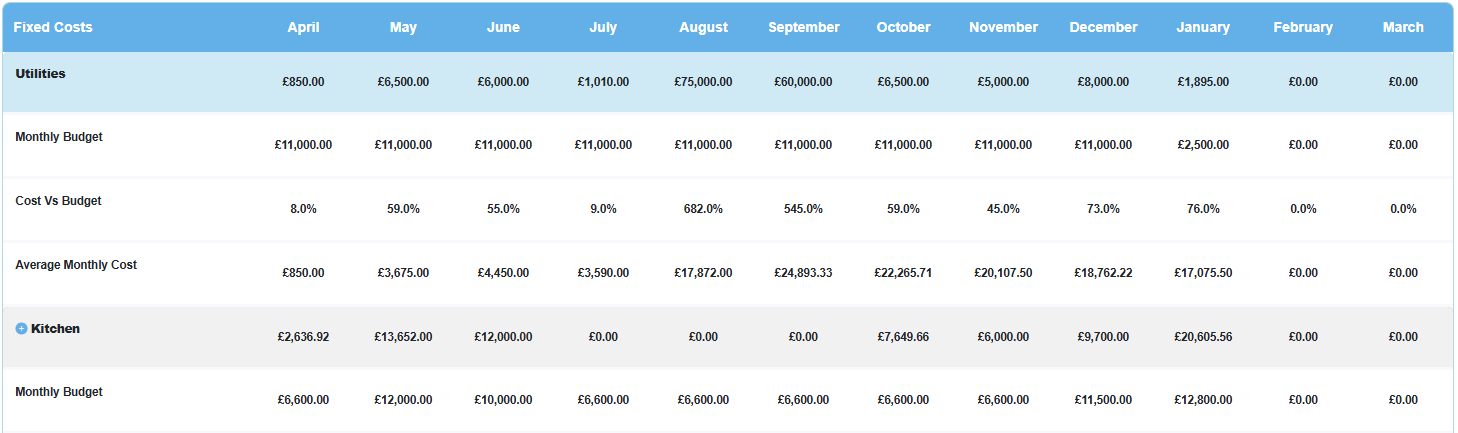
The real power of this tool is in the Annual Summary section where you can see your spend for each month and across the year, your budgets, spend versus budgets and what your average costs are.
Monthly Summary Table
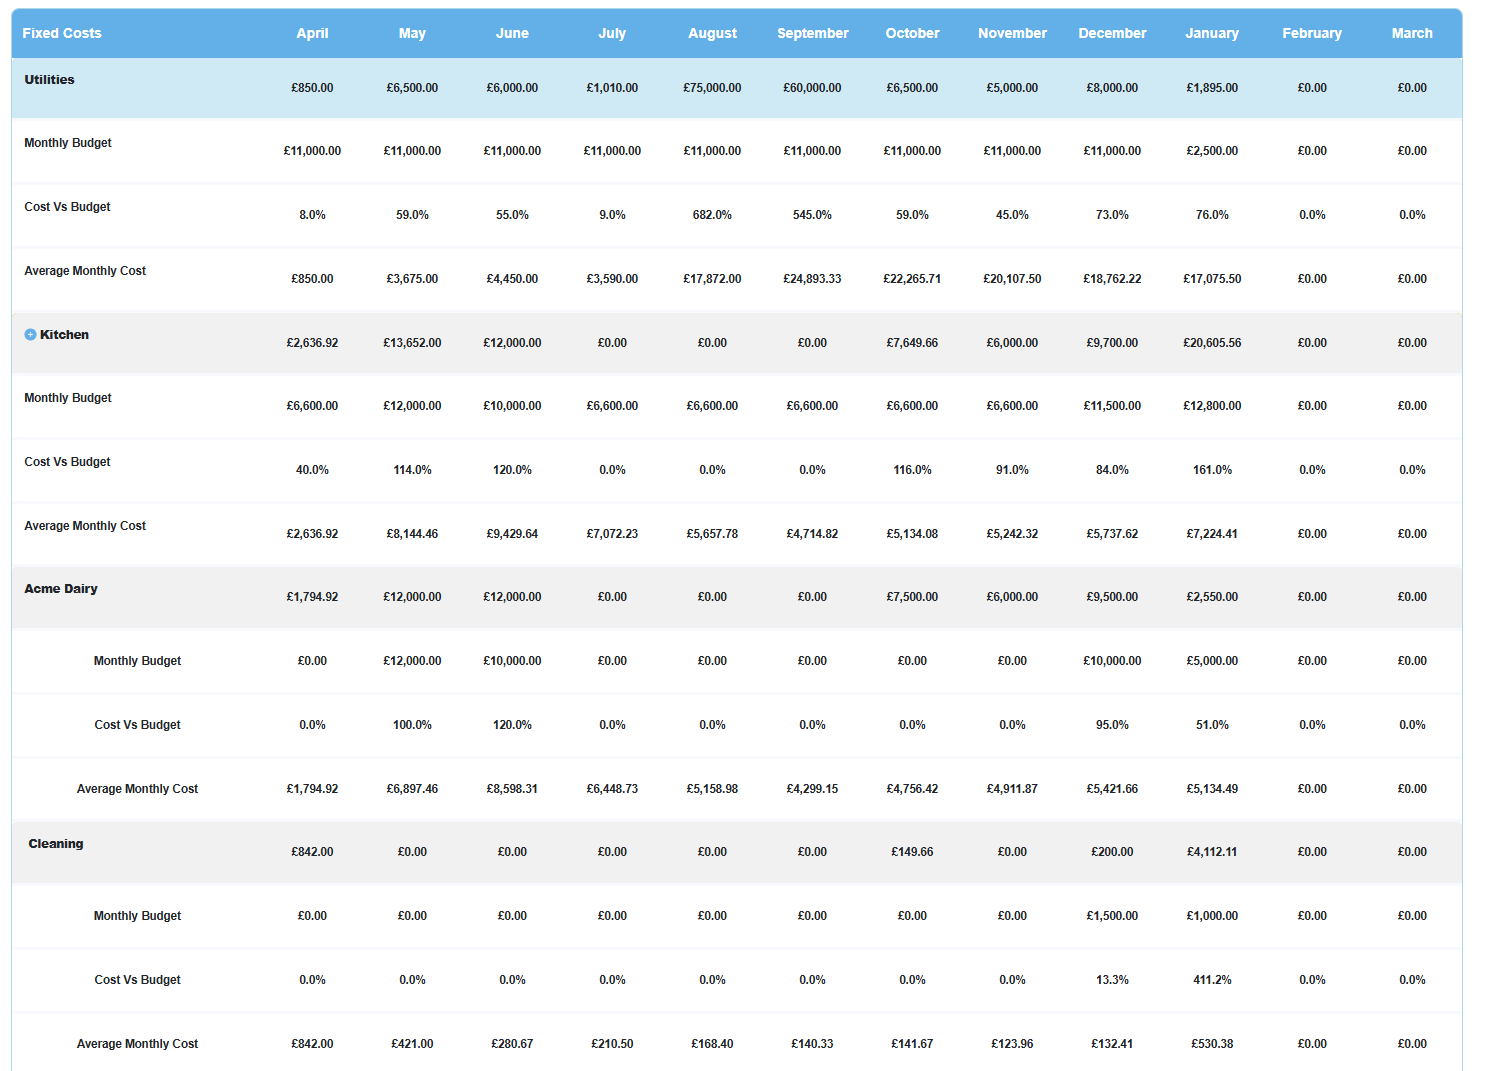
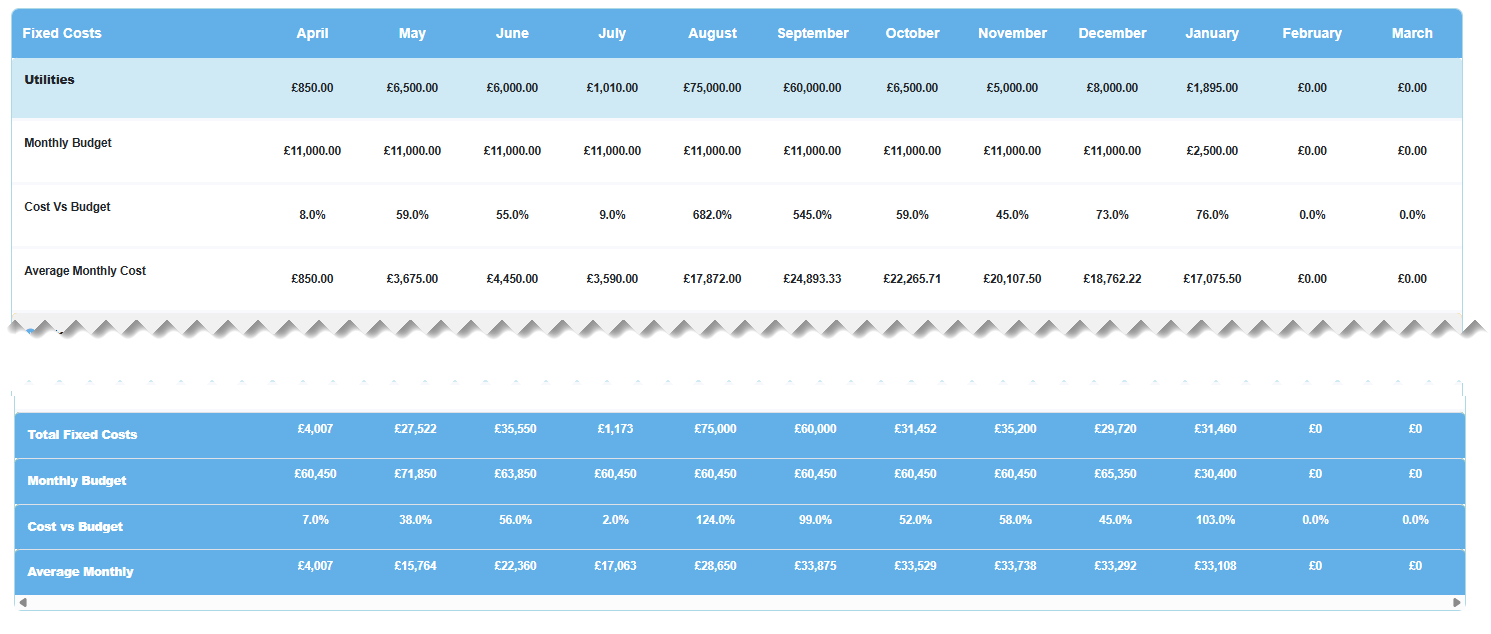
The Quality of Care Running Cost Calculator's monthly Summary tables for fixed and staff costs shows a summary of your spend for each month.
If a monthly table has sub-sections you can open it up to show those subsections spend, budget and cost versus budget percentages.
So, in this case, if 'Kitchen' looks like a higher than usual spend you can see which subsection is causing that increased spend.
See your total fixed and staff monthly costs and as the months progress the tool calculates an accurate monthly average cost for both.
Accumulative Summary Table
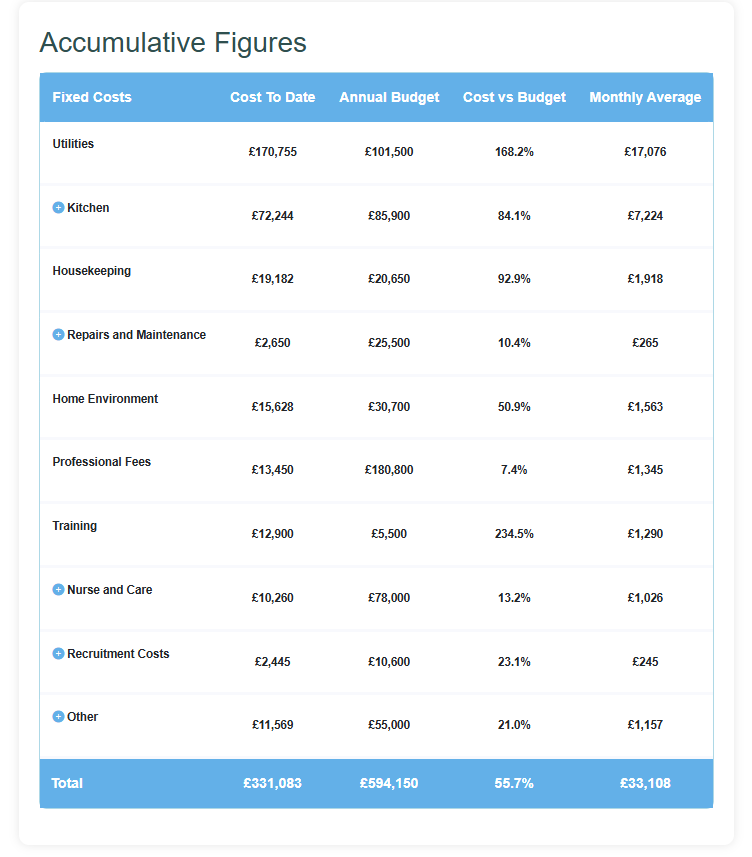
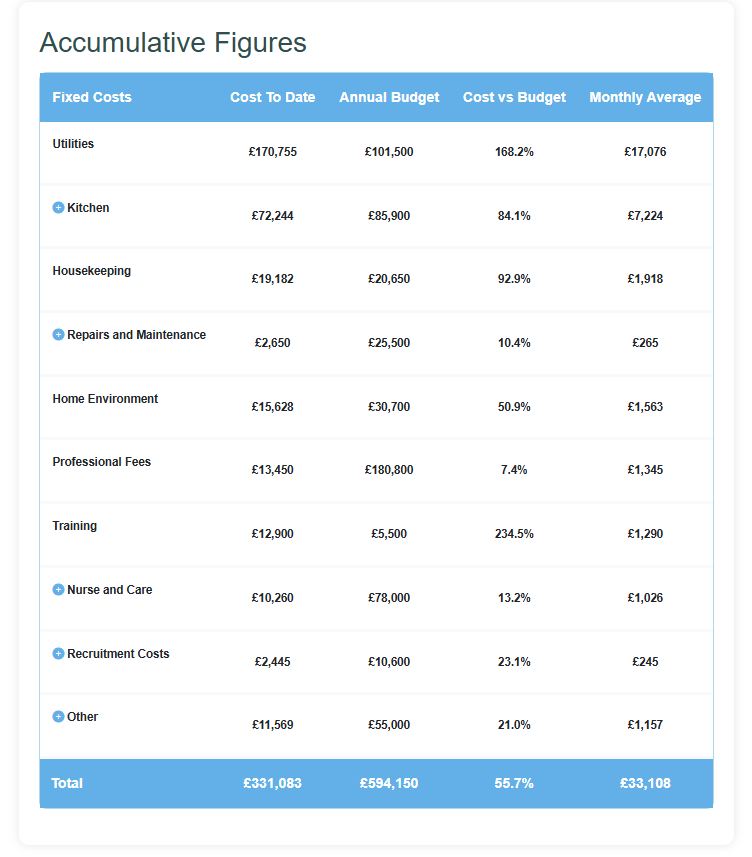
All of your monthly costs are summarised to give you a year-to date summary of your spend to date, budget, comparison and average monthly spend.
Finally, you will see your annual total spend, total budget, comparison of the two and your average monthly spend across the year.
I know it looks complicated but in next to no time you'll see which areas are overspending.
You'll be able to see if your kitchen costs are getting out of hand because your new chef has been watching too much 'Master Chef'.
If after a couple of months your spend is showing 40% of budget instead of around 25%, you know you have a problem and may need to go and speak to that chef.
Are you spending too much on agency staff? See how much agency staff are costing you and how much that cost is compared with your employee cost.
The total average monthly costs will help you set your minimum breakeven point for your bed fees.
But if you prefer a more visual outlook and easier to see results at a glance then the tool also gives you charts, charts and more charts.
Charts, Charts and More Charts
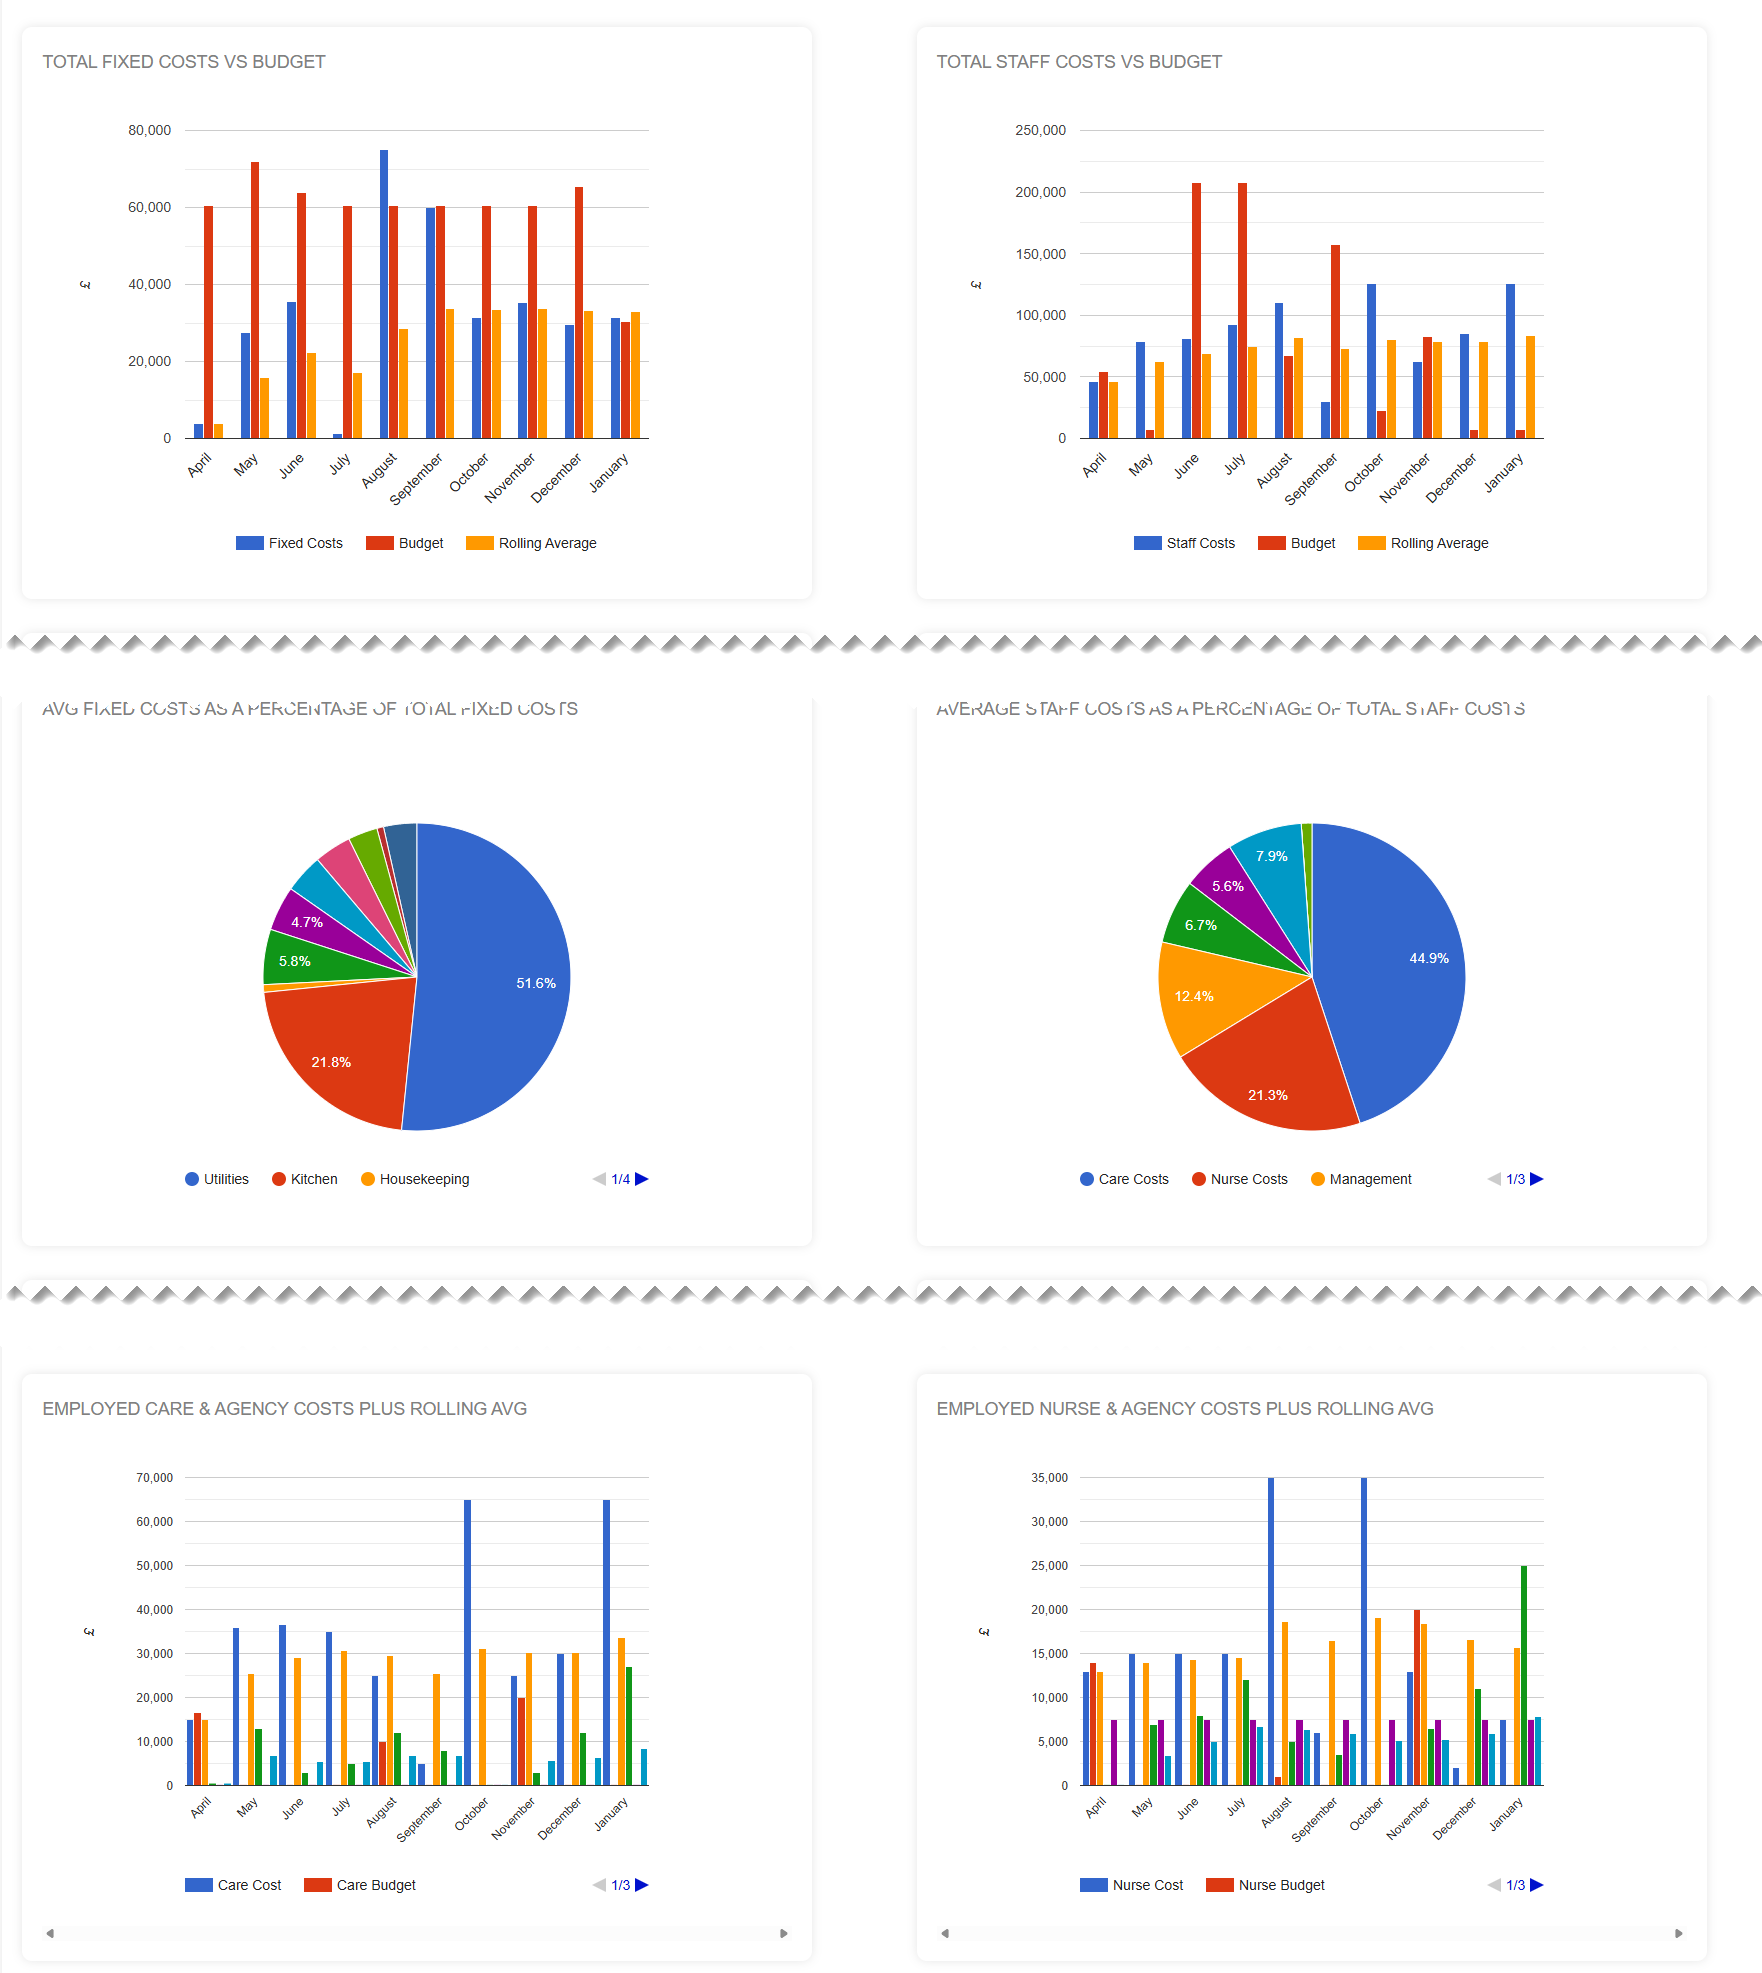
If pictures are your thing then all that you see in the tables are shown in charts.
Whether it's a big picture, 30,000 foot view you want or the finer department details, there's nothing quite like a picture to give you an instant view of what's going on.
See how your spend is trending compared to your budgets and instantly spot where you are overspending.
Aaaah…pictures - don't you just love them?
I want you to be sure that this tool is going to work for you. I want to eliminate any doubts that you may have.
If at anytime during this 60-day trial you decide that this tool isn't for you, simply let us know and we’ll make sure your payment isn’t taken.
You have nothing to lose and the potential to take control of the financial health of your care business.