WHY YOU SHOULD USE THE RUNNING COST CALCULATOR
To control your care business, you need to be able to know and control your costs.
The Running Cost Calculator will help you do just that.
Key Benefits
- Control your costs - control your care business.
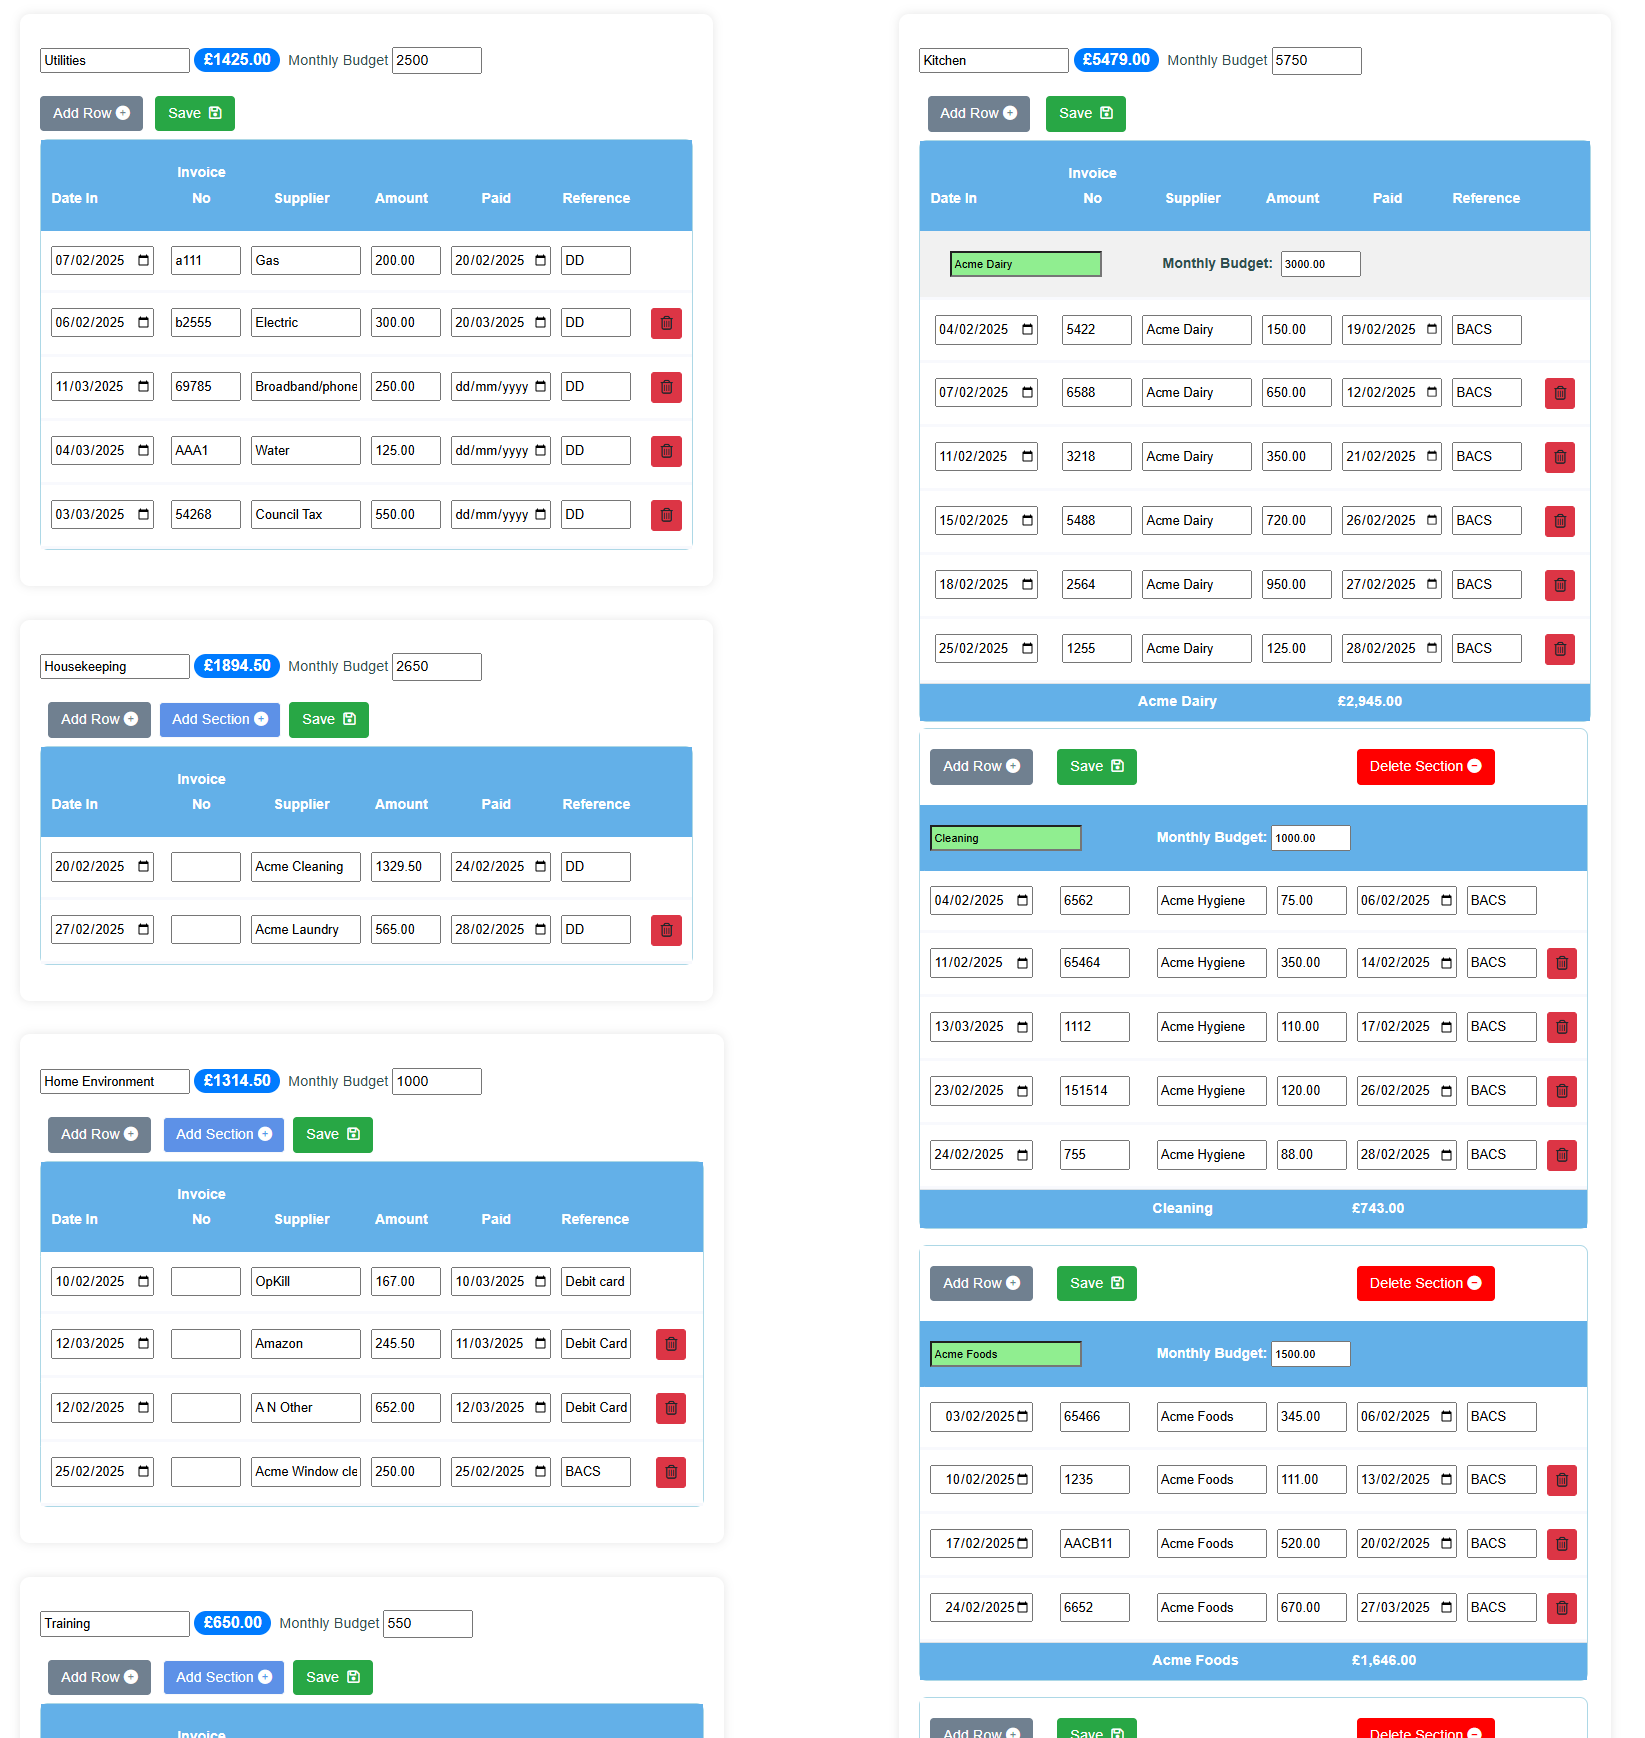
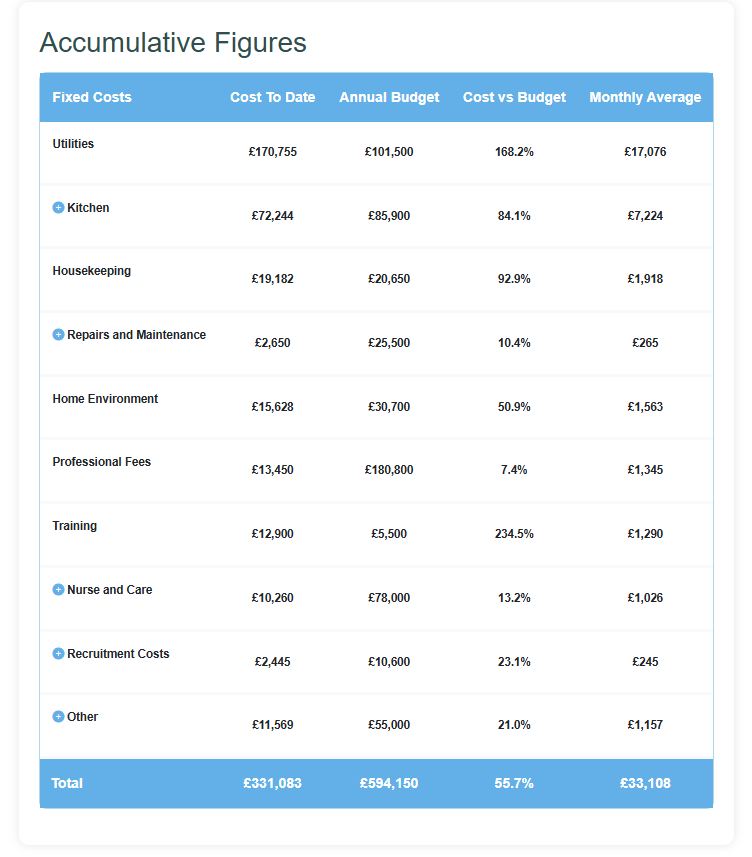
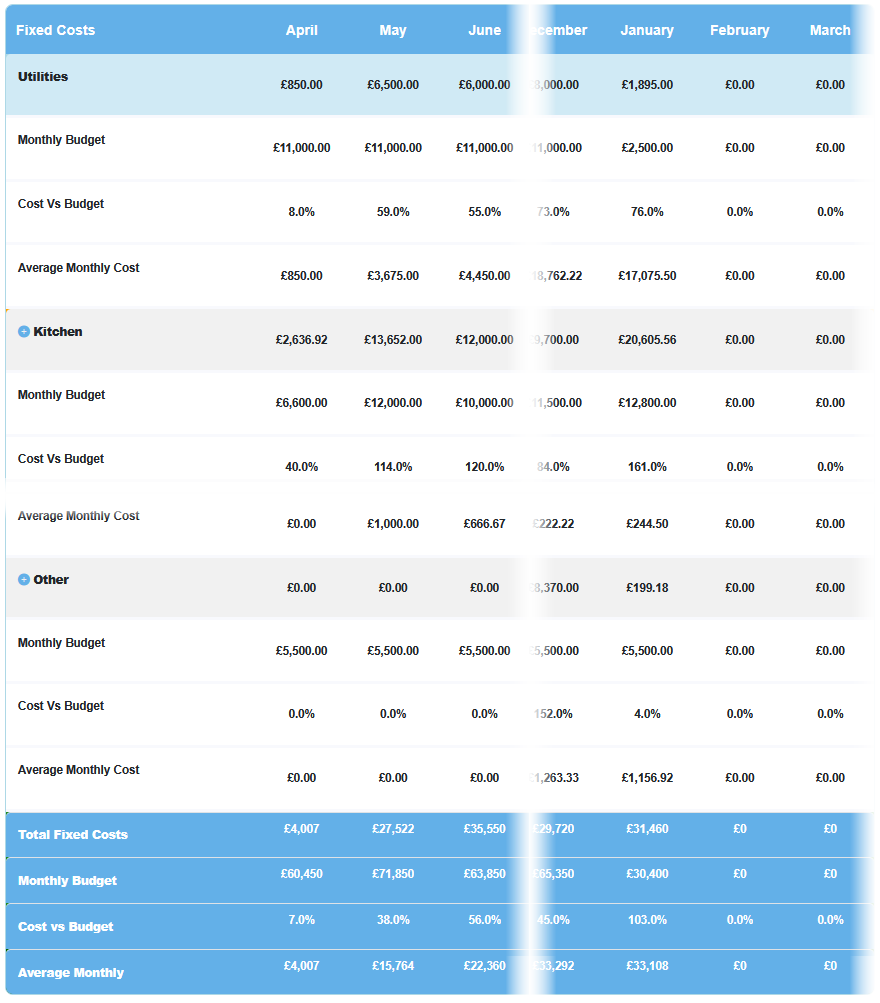
- Set clear monthly budgets and see at a glance if those budgets are being exceeded.
- Establish average monthly costs so that you can set more accurate fees and justify them.
- Make better decisions on things like the financial impact of an empty bed versus filling it for a fee that is too low.